Health Care Access & Coverage
Blog Post
The Real Opportunities of MIPS Payment Adjustments
Part 1 of a 3-part Health Affairs blog series
[Reposted: Joshua M. Liao, Anders Chen, and Amol S. Navathe. The Real Opportunities of MIPS Payment Adjustments, Health Affairs Blog, October 29, 2018. https://www.healthaffairs.org/do/10.1377/hblog20181026.940799/full/: Copyright ©2018 Health Affairs by Project HOPE – The People-to-People Health Foundation, Inc.]
Through the Medicare Access and CHIP Reauthorization Act of 2015 (MACRA), Medicare’s nationwide Quality Payment Program (QPP) aims to reward or penalize clinicians through reimbursement adjustments based on the value of care. The QPP offers two participation options – the Merit-Based Incentive Payment System (MIPS) track and the Advanced Alternative Payment Models (AAPM) track – that seek to shift clinicians and organizations towards value-based payments but differ with respect to program rules and requirements, financial risk, and organizational strategy. How should clinicians and health systems choose between these two tracks?
One key consideration is the potential financial upsides and downsides of each track. However, because MIPS scoring methodology is complex and incorporates a number of factors, clinicians’ ultimate professional fee (Part B) adjustments in that track may not reflect widely publicized figures of ±4% in 2017, ±5% in 2018, ±7% in 2019, and ±9% in 2020 and beyond.
These discrepancies, which complicate clinicians’ assessment of which QPP track most suits them, could inadvertently undercut Medicare’s efforts to incentivize providers to shift towards value. In this post, we aim to explain the nuances by describing key features of MIPS scoring and how they could create sizeable differences between expected and actual payment adjustments.
Domains and Composite Performance Score
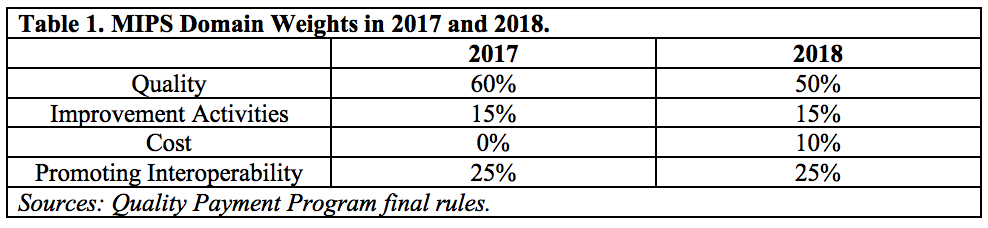
MIPS clinicians are evaluated on performance in 4 domains: quality(reporting on clinical quality measures); improvement activities (initiatives that can improve clinical practice); cost (resource utilization and spending among clinicians’ patients); and promoting interoperability (use of health information technology to improve care delivery). In 2017, Medicare weighted the quality domain the heaviest (60%), followed by promoting interoperability (25%) and improvement activities (15%), and did not factor cost (0%). These weights were adjusted slightly in 2018 (Table 1).
Performance and weights for each domain are factored together and summed to generate a composite performance score (CPS). For example, assume that in 2017 a clinician received 50 out of 100 possible points in quality, 100 out of 100 points in promoting interoperability, and 20 out of 40 points for improvement activities (cost not included due to 0% domain weight in 2017). These performance scores would be multiplied by the respective domain weights, producing domain scores of 30, 25, and 7.5, respectively, and a CPS of 62.5. Providers’ CPS can be further increased via up to 5 bonus points for small practice size and up to 5 points for patient populations with high clinical (based on Hierarchical Condition Category scores) and/or social (based on Medicaid/Medicare dual eligible status) complexity.
CPS Thresholds and Two Additional Payment Adjustments
Each year, Medicare sets a CPS threshold that determines whether clinicians and groups in MIPS ultimately receive a positive or negative payment adjustment. Providers whose scores fall below this threshold (“low performers”) receive a negative professional fee adjustment, while those with scores above the threshold (“high performers”) receive a positive adjustment. In 2017, Medicare set the CPS threshold at 3 out of the possible 100 points, increasing it to 15 points in 2018.
Clinicians’ payment adjustments depend in part on CPS relative to threshold. For example, in 2017, providers who either did not participate (CPS=0) or were worst among low performers (CPS=0.75, i.e., <25% of threshold) were at risk for the full -4% payment adjustment. Providers scoring better than worst performers but still below the CPS threshold were at risk for a negative adjustment between -4% and 0%, applied on a linear sliding scale. High performers scoring above the threshold (CPS>3) were eligible to receive a positive payment adjustment up to 4%, similarly applied on a linear sliding scale.
Beyond these features, positive MIPS payment adjustments are subject to two additional factors.
Scaling Factor
By MACRA statute, payment adjustments in MIPS must be budget neutral. Therefore, money from negative adjustments obtained from poor performers are redistributed as positive adjustments to high performers. Medicare accounts for the potential asymmetry in professional fee payments between low and high performers by multiplying the generally publicized adjustment amounts by a scaling factor (set between 0 and 3 by statute).
In scenarios where there are unequal numbers of clinicians above and below the CPS threshold (i.e., the scaling factor is not 1), the scaling factor can fall into 2 ranges:
- Between 1 and 3: This would occur if there were more low than high MIPS performers, resulting in funds collected from low performers being distributed among a relatively small group of high performers and upward adjustments greater than generally publicized amounts per high performer.
- Between 0 and 1: This would occur if there were more high than low MIPS performers, resulting in funds collected from low performers being distributed among a relatively larger group of high performers and upward adjustments less than generally publicized amounts per high performer.
Exceptional Performance Bonus
Each year, Medicare attempts to reward the highest performing MIPS clinicians and organizations (i.e., the best of the high performers) by setting an additional exceptional performance CPS threshold. Separate from considerations described above, providers scoring above this threshold receive an additional positive payment adjustment. Such adjustments are awarded on a linear sliding scale between 0.5% and 10% of professional fee payments (i.e., 0.5% for clinicians with CPS right at the exceptional performance threshold and 10% at the maximum CPS of 100).
Medicare funds these additional upward adjustments via a separate budget of up to $500 million, not via downward adjustments collected from low performers. However, given that the budget is fixed while professional services provided by exceptional performers may vary in a given year, Medicare again applies a scaling factor (ranging from 0 to 1) depending on the number of exceptional performers in a given year.
Impact on Actual MIPS Payment Adjustments
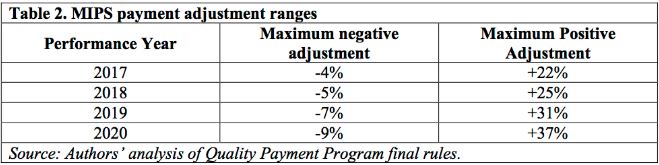
Together, these elements produce adjustment ranges that are larger than generally publicized amounts and make it even harder for clinicians to realistically estimate their MIPS adjustments. For example, in 2017, adjustments could have ranged from -4% up to +22% (comprised of the generally publicized amount of 4%, scaled by a factor of 3 and inclusive of a 10% exceptional performer bonus). In 2018, this range expanded, ranging from -5% to +25%. Adjustment ranges will continue to widen year and year until 2020, when it spans -9% to a potential +37% (Table 2).
Collectively, this MIPS scoring approach creates uncertainty for clinicians. In an upcoming post, we will discuss several implications of such uncertainty and their potential impact on how clinicians decide to participate in QPP and value-based payments.