Health Care Access & Coverage | Health Equity
Blog Post
Measuring The Burden of Health Care Costs for Working Families
Megan McCarthy-Alfano, Aaron Glickman, Kristin Wikelius, and Janet Weiner for Health Affairs
[Original post: Megan McCarthy-Alfano et al., Health Affairs Blog, April 5, 2018. Measuring The Burden of Health Care Costs for Working Families https://www.healthaffairs.org/do/10.1377/hblog20190327.999531/full/. Copyright ©2020 Health Affairs by Project HOPE – The People-to-People Health Foundation, Inc.]
Political debate over the Affordable Care Act has defined the health policy political landscape for nearly a decade. The impassioned back and forth over whether to “repeal and replace” or strengthen and defend the law has been a focus of multiple election cycles and millions of dollars in political ad spending. Amidst this ongoing discourse, it is easy to overlook the law’s important reforms to employer-sponsored insurance (ESI), which covers the majority of nonelderly Americans. The escalating costs faced by individuals and families with ESI have received far less attention than costs on the individual market or in public programs, but affordability concerns for this group are no less important.
Anecdotes and surveys suggest that families with ESI face major challenges in paying for their health care. Late last year, Kaiser Health News profiled a family of three earning $100,000 a year who accumulated $12,000 in medical debt, despite having ESI, earning income from four jobs, and experiencing no major health issues. Unfortunately, this story is not a rarity for American families. In 2018, one quarter of U.S. adults reported that cost was the nation’s most pressing health care issue, and 61 percent noted that paying higher premiums or a greater portion of medical expenses was a “major concern.” Roughly half of U.S. adults worried that they would not have enough money to afford care. The burden of health care costs is heavy, and growing.
Developing A State-Level Cost Burden Index
In a new issue brief from the Leonard Davis Institute of Health Economics at the University of Pennsylvania (“Penn LDI”) and United States of Care (“US of Care”), we used publicly-available data to produce state-level estimates of the cost burden faced by working families covered by ESI from 2010 to 2016, a period that includes recovery from the 2008-2009 financial crisis and the implementation of the Affordable Care Act (ACA). We adapted a national-level affordability index to capture the share of household income consumed by ESI premiums in each state. A recent Commonwealth Fund brief used similar methods to analyze state-level trends in ESI among middle income families between 2008 and 2017. We expand on this work by considering the total premium for family coverage, including both employee and employer contributions, and adjusting state incomes based on local cost of living.
We believe policymakers need indices of health care costs that are straightforward and digestible. We chose to focus on insurance premiums for households as a measure of the cost burden. To be sure, this is an incomplete measure, as it doesn’t capture consumer out-of-pocket costs. However, insurance premiums are a useful benchmark of the net cost to a household to gain some protection from catastrophic financial losses, and it has both common sense meaning and policy relevance. By adjusting income for cost-of-living differences across states, we can help policymakers better understand the burden of premiums on the family budget. Because all families with insurance pay premiums, but only a portion meet their deductible, we analyze deductibles separately. A full explanation of our theory and methods can be found in our issue brief.
Cost Burden Is Growing, And There Is A High Level Of Variation Across States
Although public opinion suggests that most individuals like their employer coverage, our analysis reveals that the affordability of ESI remains problematic, and may be getting worse. Working families experience a high and often growing burden of health care costs, as measured by the share of household income devoted to ESI premiums. Nationally, the cost burden has grown from an average of 28 percent in 2010 to 30 percent in 2016, with premiums growing faster than income. During this time, family premiums for ESI rose 27.7 percent (from $13,871 to $17,710), while median household income rose 19.8 percent (from $49,276 to $59,039). This suggests that in some states, premium increases may have swamped new income, driving up the cost burden. From 2010 to 2016, just 3 states (Minnesota, Tennessee, and Texas) and the District of Columbia saw a decreasing cost burden, while most states saw their burdens increase by at least 5 percent. A rising cost burden can result from stagnating income, rising premiums, or a combination of the two trends. Regardless of the underlying reason, employees experience these costs as less “take home pay.”
Exhibit 1: Health Care Cost Burden 2010
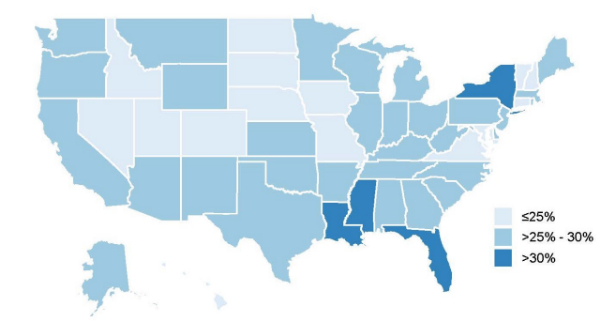
Source: The Burden of Health Care Costs for Working Families 2019.
Exhibit 2: Health Care Cost Burden, 2016
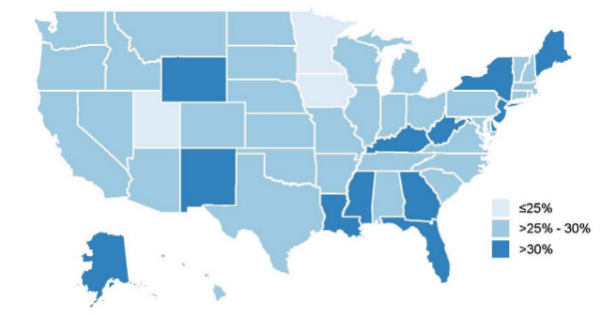
Source: The Burden of Health Care Costs for Working Families 2019.
Rising Deductibles Also Contribute To Health Care Costs
While the cost burden estimates ESI premiums as a share of household income, it does not include deductibles — the amount employees and families pay for health care before insurance kicks in. Deductibles are not factored in to the cost burden index because costs are incurred only when someone seeks care. But deductibles are an important measure of what families must pay when someone gets sick — precisely when the affordability of health care matters most. Thus, we also looked at how deductibles have changed in ESI across states.
Between 2010 and 2016, the percent of employees enrolled in health plans with a deductible climbed from 77.5 percent to 84.5 percent. The average amount of the annual deductible these families face increased as well, from $1,975 in 2010 to $3,069 in 2016. This represents growth of 55.4 percent nationally, but it varies by state. Employees in the five states with the lowest deductibles faced an average of $2,403 before insurance kicked in, compared to $4,112 in the states with the highest deductibles (Exhibit 3).
Exhibit 3: Average Annual Deductibles for Family Coverage, 2010 and 2016
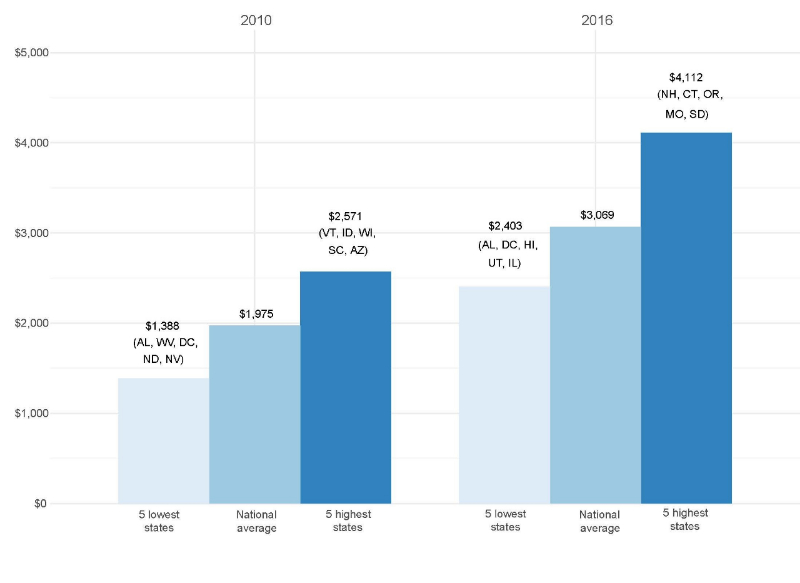
Source: The Burden of Health Care Costs for Working Families 2019.
Although deductibles are often used to keep individual plan premiums down, we found no association between state-level deductibles and average premiums. Our data do not permit further analysis of this finding, but it is possible that any dampening effects on premiums are being swamped by local market and labor dynamics in each state. The overall rise in deductibles, however, demands attention from policymakers seeking to address health care costs. In light of estimates that 4 in 10 Americans cannot afford an unexpected $400 expense, the potential of facing significant out-of-pocket costs could dissuade individuals from seeking care altogether. As a result of high out-of-pocket costs and rising deductibles, more Americans are underinsured today than in 2010, particularly those in employer plans. For instance, a recent study found that women in ESI who switched from low to high deductible health plans were more likely to delay breast cancer diagnosis and treatment. In states with the highest deductibles, such as New Hampshire and Connecticut, policymakers might consider policies to promote increased use of tax-advantaged Health Savings Accounts (HSAs) or Health Reimbursement Accounts (HRAs) to help families cover out-of-pocket expenses.
Given the level and growth of deductibles in ESI, there is little room to reduce premiums further by increasing cost sharing with employees (or reducing benefits), without diminishing the accessibility of care at the point at which it is most needed. The cost burden of ESI cannot be eased by merely shifting the burden to families when they need care.
Implications For Families And Policymakers
Americans’ concerns about rising health care costs are more than mere anxieties; they have very real consequences for families, their health-seeking behavior, and their quality of life. A 2018 survey by the West Health Institute and NORC at the University of Chicago found that 40 percent of Americans have forgone a recommended test or treatment in the last year due to health care costs, and 32 percent could not fill a prescription or received only a partial fill. Another 30 percent reported struggling to pay for basic necessities such as food, heat, and housing due to medical costs.
Our index sheds a light on the health care cost burden faced by working families in ESI, which is often overlooked in the political debate. While the burden remains high nationally, the variation across states suggests that there may not be a one-size-fits-all solution to lowering health care costs. There are many co-occurring causes of rising health care cost burdens, and policymakers in each state must develop local solutions based on the nature of premium increases and income growth, while also recognizing the central role of ESI in covering the majority of Americans.
At the same time, it is important to remember that a state’s cost burden index does not necessarily reflect how all families experience health care costs. Many families in states with a “lower” cost burden, like Minnesota (24.4 percent in 2016) and Utah (24.5 percent in 2016), may still struggle to pay health care expenses, particularly if they have chronic or complex conditions and incur high deductible payments or out-of-pocket costs. Health care costs are felt as a substantial financial load even in the “lowest burden” state of Minnesota, where average family premiums consume approximately one quarter of household income. Similarly, although the cost burden approaches 40 percent of income in the “highest burden” states, such as Louisiana (37.1 percent in 2016) and New York (36.5 percent in 2016), families with higher incomes are likely relatively insulated from the high cost burden.
For millions of Americans, lower health care costs could mean eliminating the difficult choices between receiving a lifesaving treatment or paying the mortgage; insuring their spouse or sending a child to college; or filling a prescription or putting food on the table. Even for those who do not face these choices, increases in the overall burden ultimately suggest that working families are falling further behind, with a higher percentage of their income devoted to premiums and not available for other needs. State policymakers can use this simple cost index to identify trends and track their success in reducing this burden for their constituents.
Megan McCarthy-Alfano is a project manager at Penn LDI.
Aaron Glickman is a policy analyst for the Department of Medical Ethics and Health Policy at the University of Pennsylvania and Penn LDI.
Kristin Wikelius, MPA, is the senior policy director at United States of Care.
Janet Weiner, PhD, MPH, is co-director for health policy at Penn LDI.