
Acupuncture Could Fix America’s Chronic Pain Crisis–So Why Can’t Patients Get It?
A Proven, Low-Risk Treatment Is Backed by Major Studies and Patient Demand, Yet Medicare and Insurers Still Make It Hard To Use
Brief

This brief analyzes the supply of primary care providers serving the Medicaid population in Philadelphia, and the geographic variability of this measure across the city. It also examines important measures of access – appointment availability and wait time for an initial appointment – that highlight challenges faced by Medicaid patients.
The 2015 Medicaid expansion in Pennsylvania added over 700,000 nonelderly adult enrollees to the state’s Medicaid program.1 Approximately 21 percent of adults in Philadelphia are enrolled in Medicaid.2 Ensuring that their coverage translates into access to quality care is a policy priority since providers are less likely to accept Medicaid patients.3,4,5 Though Medicaid coverage has been linked to the increased receipt of primary care, with greater increases in states that expanded Medicaid after the Affordable Care Act6,7,8 there are concerns that the primary care workforce in certain areas may be unable to meet the increase in demand.9 Given low reimbursement rates compared to private insurance and Medicare, Medicaid patients may be disproportionately affected by limited primary care capacity.
A study conducted in 2014 analyzed primary care access in Philadelphia and found that the overall supply of primary care providers was adequate according to federal provider shortage definitions.10 However, it also showed a great deal of variation across the city—in areas with lower access, there were 10 times more adults per provider than in areas with higher access.11
Building on this earlier work, Penn LDI conducted analyses for the City of Philadelphia’s Staying Healthy – Access to Primary Care in Philadelphia report, which updates previous findings with 2016 data, while bringing in additional data on appointment availability and wait times for primary care.
As reflected in this brief, we conducted spatial analyses and measured the primary care provider-to-population ratio for Medicaid patients using data from the SK&A Office-Based Physician Database and the American Community Survey. Second, we used audit data of primary care practices in Philadelphia to measure the average appointment availability rate and wait times for simulated Medicaid patients, comparing them to privately insured individuals. Finally, we compared the appointment availability rate and wait times in Philadelphia Medicaid to other major metropolitan areas.
First, we focused on the supply of primary care providers by estimating the primary care provider-to-population ratio in every Census tract in Philadelphia, a proxy for a neighborhood. The number of providers who accepted Medicaid was taken from the SK&A Office-Based Physician Database, while the population of Medicaid patients was taken from the 2012-2016 American Community Survey.
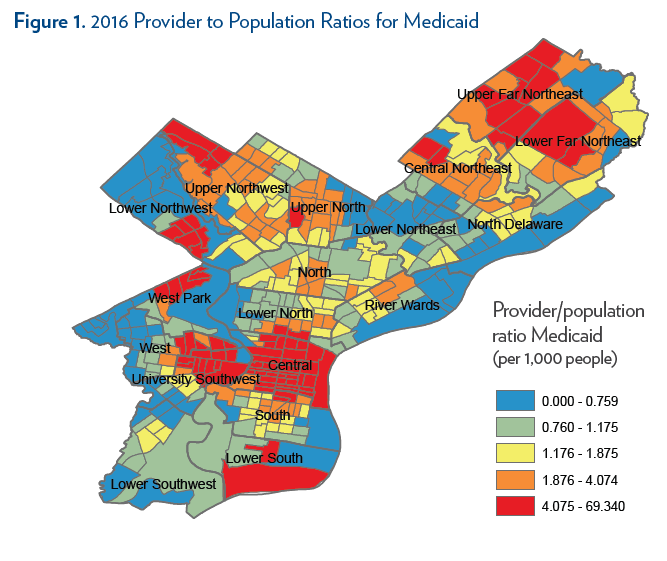
We found that the average provider-to-population ratio was 4.4 providers per 1,000 Medicaid patients in 2016. Estimates were highly skewed, however: the median provider-to-population ratio was 1.6 providers per 1,000 Medicaid patients. Notably, data are not available to determine how much of each provider’s time is allocated to Medicaid patients (versus other patients). This limits our ability to compare these supply ratios to established benchmarks for health professional shortage areas.
As Figure 1 shows, there is substantial variation across Philadelphia. The highest provider-to-population ratios were in Central Philadelphia and University City, which are also home to major health systems, and some selected pockets in the far North and Northwest Philadelphia. Areas with low provider-to-population ratios were scattered across the city, with larger swaths in West Philadelphia, Southwest Philadelphia, and sections of Northeast Philadelphia (particularly the lower Northeast).
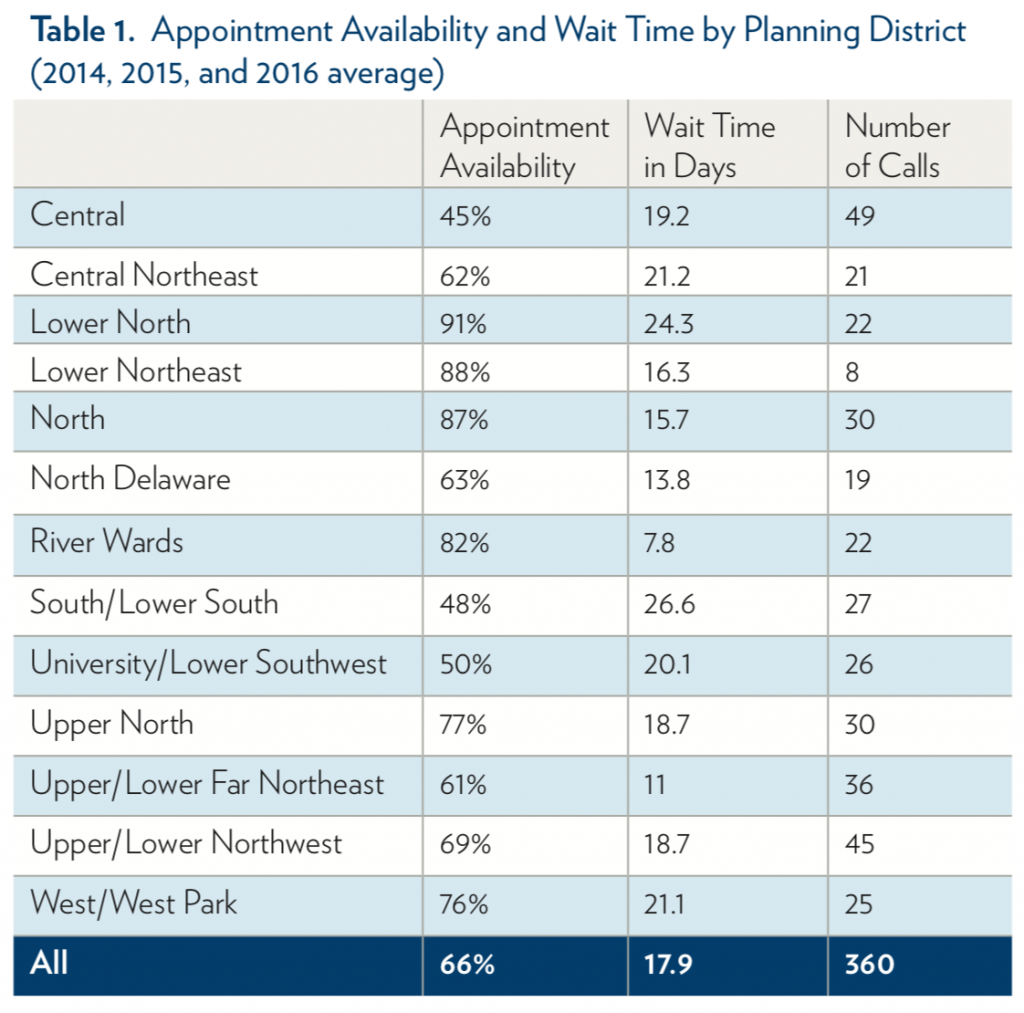
We used unique audit data from 2014, 2015, and 2016 in which callers simulated Medicaid patients and requested new patient appointments from primary care practices that were determined to be in-network with a pre-audit survey. We examined two dimensions of primary care access: the appointment availability rate, which is the share of in-network offices that successfully scheduled appointments with callers; and wait time, which is the number of calendar days between the phone call and scheduled appointment. In total, 736 calls were made to primary care practices (360 calls featured a simulated patient with Medicaid, while 376 were made by a simulated patient with private insurance) with a majority of calls occurring in 2015. We saw no evidence that appointment availability or wait times changed before and after Medicaid expansion, but our sample size did not allow us to make valid year-to-year comparisons. Therefore, we pooled the three years of data together.
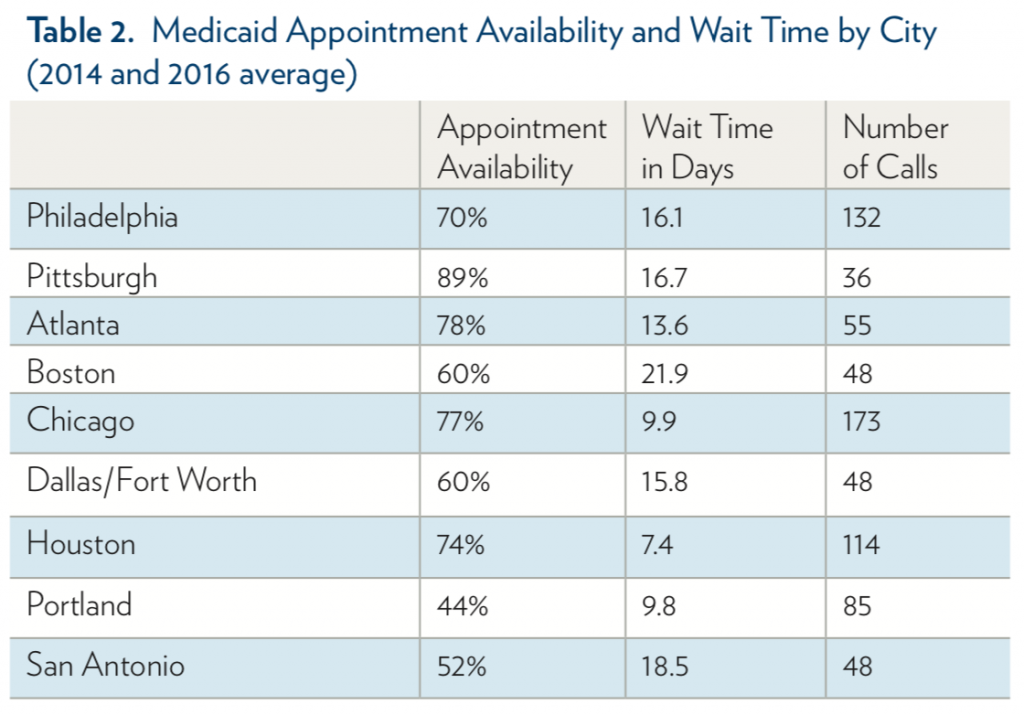
We compared appointment availability and wait times in Philadelphia with those of other major metropolitan areas (Table 2). Measures in other cities are only available in the audit studies conducted in 2014 and 2016. Overall, Philadelphia lies in the middle of the pack in terms of Medicaid appointment availability: the highest appointment availability was in Pittsburgh (89%), while the lowest appointment availability was in Portland (44%) and San Antonio (52%). The average number of days to appointment was 16.1 days in Philadelphia. By comparison, the longest waits were in Boston (21.9 days) and the shortest waits were in Houston (7.4 days).
In 2016, Philadelphia had 4.4 primary care providers per 1,000 Medicaid beneficiaries on average, with large geographic variation (the provider-to-population ratio ranged from 0 to 69 physicians per 1,000 Medicaid patients across Census tracts). Using data for 2014-2016, we also found that one out of three practices called by simulated Medicaid patients did not offer a new patient appointment, and among those who successfully scheduled appointments, wait times were 18 days on average. Compared to other metropolitan areas, Philadelphia ranked in the middle in terms of appointment availability and wait times for Medicaid patients.
Addressing poor access to primary care in rural areas has long been a focus for policymakers, but disparities in access within cities remains a major issue. Patients in urban areas face unique challenges; they are more likely to rely on public transportation and face congestion issues, for example. Our results show that access to primary care in urban areas varies widely—while Medicaid appointment availability in Philadelphia is over 20 percentage points higher than in Portland, it is nearly 20 percentage points lower than in Pittsburgh.
Researchers and policymakers must identify areas where Medicaid patients are facing travel and other barriers, and better understand the major drivers of access to primary care within and between cities. As our analysis shows, it will be important to explore different measures of access, which can paint a fuller picture of the patient experience.
The study sample for supply-side measures comprises 363 Census tracts in the City of Philadelphia. For the provider-to-population ratio, we used the American Community Survey 2012-2016 5-year average to determine the number of Medicaid recipients in a given Census tract. The number of providers accepting Medicaid was taken from the SK&A Office-Based Physician Database, which is a regularly updated registry of physician practices covering up to 90% of practices. Figure 1 depicts Medicaid provider to publicly-insured population ratios within one mile of each Census tract centroid, broken into quintiles.
For the appointment availability rate and wait times, we used audit studies in which trained and scripted callers simulated patients with Medicaid and called offices in Philadelphia in 2014, 2015, and/or 2016 to request new patient appointments. In 2015, all primary care practices in Philadelphia were included in the sample. In 2014 and 2016, the primary care practices were randomly selected from a sample frame using SK&A data that includes all offices staffed with at least one primary care physician treating working-age adults. Offices in other cities were included in the sample frame in 2014 and 2016, We conducted a pre-audit survey of potentially eligible offices, supplemented by online resources, to ensure eligibility and to confirm insurance plans accepted by each office in the 2014 and 2016 sample. Offices needed to confirm participation in a specific insurance plan within the insurance type (i.e. a specific Medicaid managed care plan) to be eligible for the audit. In the 2015 sample, we used plan network directories to confirm participation of each practice in a Medicaid plan.
Callers requested a new patient appointment for either a routine check-up or an urgent health concern (newly diagnosed untreated hypertension). Callers requested the earliest appointment available with the selected primary care physician, but would accept appointments with any available primary care provider in the office, including a nurse practitioner or physician assistant. A successful appointment was defined as an offer of a specific date and time, even if the caller was told that the appointment could be scheduled pending additional information (e.g., an insurance number). Any scheduled appointments were cancelled at the end of the call or immediately thereafter.
The analysis has some limitations. For the provider-to-population ratio, there is likely to be measurement error in ACS 5-year averages. Also, there may be inaccuracies in provider Medicaid participation from SK&A and from Medicaid plan provider directories. In the audit studies, the sample is restricted to in-network offices, so our estimates do not reflect changes in the size of Medicaid networks. Further, callers simulated new nonelderly patients, so we cannot be sure how access changed for pediatric, elderly, and established patients.

This analysis was conducted for the City of Philadelphia’s Staying Healthy – Access to Primary Care in Philadelphia report. The views expressed here do not necessarily reflect the views of the Department.
A Proven, Low-Risk Treatment Is Backed by Major Studies and Patient Demand, Yet Medicare and Insurers Still Make It Hard To Use

Chart of the Day: Medicare-Medicaid Plans—Created to Streamline Care for Dually Eligible Individuals—Failed to Increase Medicaid Participation in High-Poverty Communities
Research Brief: Shorter Stays in Skilled Nursing Facilities and Less Home Health Didn’t Lead to Worse Outcomes, Pointing to Opportunities for Traditional Medicare

How Threatened Reproductive Rights Pushed More Pennsylvanians Toward Sterilization

Abortion Restrictions Can Backfire, Pushing Families to End Pregnancies

They Reduce Coverage, Not Costs, History Shows. Smarter Incentives Would Encourage the Private Sector