
Contradictions That Confuse Federal Food Policies
Announcing Bold New Goals While Crippling the Infrastructure Needed to Achieve Them
Population Health
Blog Post
The government-funded Supplemental Nutrition Assistance Program (SNAP) provides food assistance to low-income individuals in the U.S. As the pandemic unfolded, SNAP was crucial in combating food insecurity, the economic and social condition of inadequate access to high quality food on a consistent basis. In 2020, around 40 million low-income individuals received SNAP benefits, up from 35 million in 2019.
We know that SNAP is an important tool in addressing poverty during times of economic need. But does it affect health as well? Previous studies have suggested that SNAP participants have improvements in self-reported health. Food insecurity has been tied to a number of medical conditions, notably cardiovascular risk factors such as diabetes. Changes in food insecurity levels are even associated with improvements in population-level cardiovascular mortality rates. In a new study in Diabetes Care, we investigate the relationship between the prevalence of diabetes at the county-level and state SNAP policies, and our findings suggest that SNAP could play a key role in the health of communities.
Understanding the association of food insecurity and food assistance with diabetes is particularly important given the continued rise of diabetes in the U.S. and disproportionate burden that falls upon low-income individuals. As of 2020, more than 1 in 10 adults have diabetes, with the prevalence twice as high among people living in poverty compared to high-income individuals.
Teasing apart the relationship between SNAP participation and diabetes is complicated by the fact that low-income individuals are both more likely to be SNAP participants and have a higher risk of developing diabetes. However, as SNAP is administered by states, each state has some leeway in factors such as determining eligibility, how often participants have to show proof of income and others related to ease of access. Each of these state-level policies may affect SNAP participation, independent of factors such as income. We took advantage of these state-to-state variations in the number of people participating in SNAP to study the relationship between SNAP and the prevalence of diabetes in a given area.
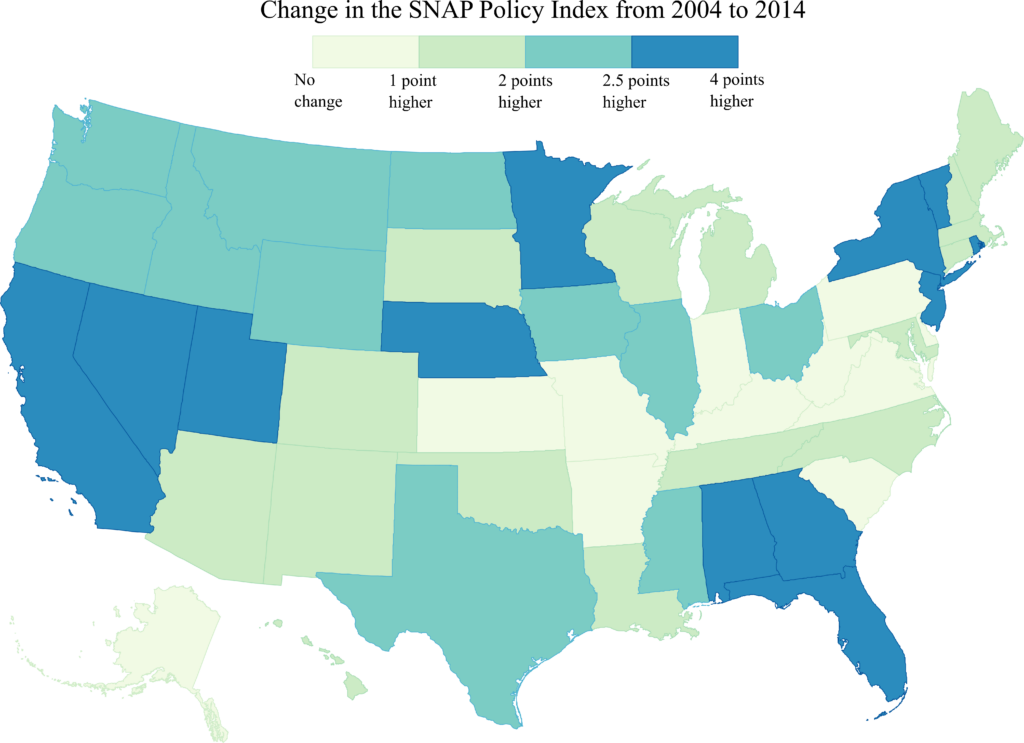
My colleagues and I used the SNAP policy index (Table 1), a measure of the degree to which state-level policies support access to and use of SNAP, including policies that affect SNAP eligibility, transaction costs, stigma, and outreach. In our analysis, we looked at change in the SNAP policy index for each state and then examined how the prevalence of diabetes changed at the county level from 2004 to 2014. All states became more generous in their SNAP policies, and the rate of change in the SNAP policy index varied from state to state (Figure 1).
| Policies | SNAP participation |
|---|---|
| Eligibility | |
| Exempts at least one but not all vehicles from SNAP asset test | Increase |
| Exempts all vehicles from SNAP asset test | Increase |
| Broad-based categorical eligibility | Increase |
| Eligibility restrictions for adult noncitizens | Decrease |
| Transaction Costs | |
| Simplified reporting for households with earnings | Increase |
| Online application availability | Increase |
| High proportion of working households with short recertification periods (1-3 months) | Decrease |
| Stigma | |
| High proportion of State benefits issued via electronic benefits transfer (EBT) | Increase |
| Fingerprinting required during application | Decrease |
| Outreach | |
| Federally funded radio or TV ad | Increase |
Table 1. Contribution of State Policies Included in the SNAP Policy Index to SNAP Participation. Adapted from USDA Economic Research Service.
After adjusting for demographic and economic factors, we found that a state having a 1-point increase in the 10-point scale of the SNAP Policy Index between 2004 and 2014 was associated with a 0.05 percentage point lower county-level diabetes prevalence per year. This means that counties with a greater increase in the SNAP policy index over this period had slower growth in diabetes prevalence rates. From 2004 to 2014, the median increase in the SNAP policy index across all states was 1.86 points. If this relationship were causal, and all states experienced this level of increase in their SNAP policy index, about 2.1 million fewer adults would have had diabetes in 2014.
So, what does this mean for the current state of SNAP? One key takeaway is that states should lower barriers to SNAP participation for eligible people. Our study demonstrates that greater participation in such programs can have important downstream effects on population-level health outcomes. In 2021, due to revisions in the estimated cost of a typical nutritious diet, the federal government permanently increased the level of assistance to SNAP recipients. How this will affect health trends is unclear, but it is possible that policies that increase the level of assistance for each participant, like those that increase the number of participants, could also positively impact future diabetes prevalence. As organizations like the Office of Management and Budget estimate the costs of the recent increase in SNAP benefits, they need to consider the potential downstream effects on chronic health conditions like diabetes. Such an approach may allow policymakers to fully appreciate the wider role programs like SNAP play in the health of communities.
The study, Changes in Supplemental Nutrition Assistance Program Policies and Diabetes Prevalence: Analysis of Behavioral Risk Factor Surveillance System Data From 2004 to 2014, was published in Diabetes Care in October 2021. Authors include Sameed Ahmed M. Khatana, Nicholas Illenberger, Rachel M. Werner, Peter W. Groeneveld, and Nandita Mitra.

Announcing Bold New Goals While Crippling the Infrastructure Needed to Achieve Them

Promising New Evidence and What’s Next

From 1990 to 2019, Black Life Expectancy Rose Most in Major Metros and the Northeast—but Gains Stalled or Reversed in Rural Areas and the Midwest, Especially for Younger Adults

A Penn LDI Seminar Focuses on Why They’re Important for the Future

Former Philadelphia Health Commissioner Warns That Gutting the CDC, Undermining Vaccines, and Politicizing Science Will Leave the U.S. Dangerously Unprepared for the Next Pandemic

Rural Parents Had More Emergency Visits and Insurance Loss Than Urban Peers, an LDI Study Shows. Integrated Baby Visits Could Help All Parents Be Healthier