
Employment Protections for Individuals Experiencing Menstruation, Perimenopause, or Menopause
Testimony: Delivered to Philadelphia City Council’s Committee on Health and Human Services
Policy

In December 2025, LDI Executive Director Rachel M. Werner, MD, PhD and LDI Fellow Paula Chatterjee, MD, MPH and analyst Eliza Macneal completed an analysis of the Rural Health Transformation Program (RHTP) in response to a request from the U.S. Senate Committee on Finance.
The analysis found that estimated RHTP funding is not aligned with rural health needs, unlikely to make up for projected Medicaid cuts, and slightly higher in states that have lost the most rural hospital beds.
Views expressed by the researchers are their own and do not necessarily represent those of the University of Pennsylvania Health System (Penn Medicine) or the University of Pennsylvania.
To: The Office of Senator Ron Wyden
From:
Paula Chatterjee
Senior Fellow, Leonard Davis Institute of Health Economics
Assistant Professor of Medicine, Perelman School of Medicine, University of Pennsylvania
Eliza Macneal, MS
Statistical Analyst, University of Pennsylvania
Rachel M. Werner, MD, PhD
Executive Director, Leonard Davis Institute of Health Economics
Robert D. Eilers Memorial – William Maul Measey Professor, Wharton School Professor of Medicine, Perelman School of Medicine, University of Pennsylvania
Date: December 4, 2025
Re: Response to Request for Analysis of the Rural Health Transformation Program
Thank you for requesting an independent analysis of the Rural Health Transformation Program (RHTP). This memorandum summarizes key findings on how, based on an estimate of 75% of the funds that can be projected from existing formulas in the Center for Medicare & Medicaid Services’ (CMS) application for RHTP funding, the program may affect rural health and communities.
The Program is described as follows:
This analysis provides an annualized estimate of a majority portion of RHTP funding to states. It includes “baseline funding”, which we assume is equally distributed across states.
It also includes funding attributable to the rural facility and population score portion of the “workload funding”. The actual mapping of points to funding may change depending on how states are scored by CMS. But because the rural facility and population score contributes 50% of the total weight, we assume it will receive 50% of the corresponding funding ($2.5 billion per year).
We do not consider funding associated with the technical score as states’ applications for RHTP funding remain under review by CMS.
Therefore, our estimates can be considered to reflect 75% of RHTP funds based on the assumptions above. The implications of our findings could change based on how the residual 25% of funds are allocated.
Our analyses show:
We describe these findings, and others, in further detail below.
States estimated to receive the most annual RHTP funding overall, based on 75% of RHTP funds estimated using available data, include Texas, California, New Mexico, Montana, and Alaska (Appendix, Figure A1). States estimated to receive the least annual RHTP funding include Rhode Island, Massachusetts, Delaware, Connecticut, and New Jersey.
We categorized states into three groups based on the size of their rural populations (Figures 1 & 2). States included in the “high” group represent 62% of the U.S. rural population; states in the “medium” group represent 28%; and states in the “low” group represent 10%.
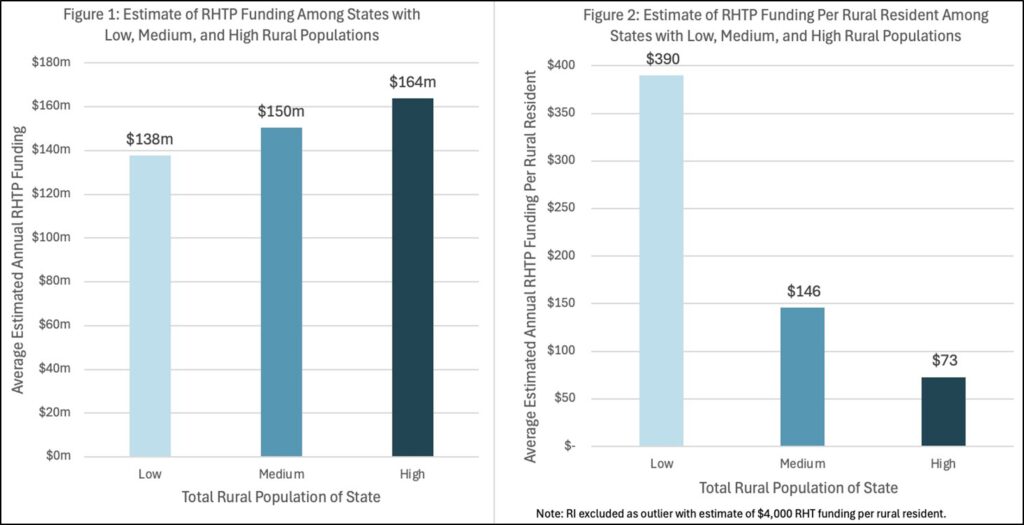
States with larger rural populations are estimated to receive more RHTP funding. Those states with the largest rural populations will receive $164 million annually in RHTP funding on average (or $73 per rural resident) while states with smallest rural populations are estimated to receive $138 million annually (or $390 per rural resident).
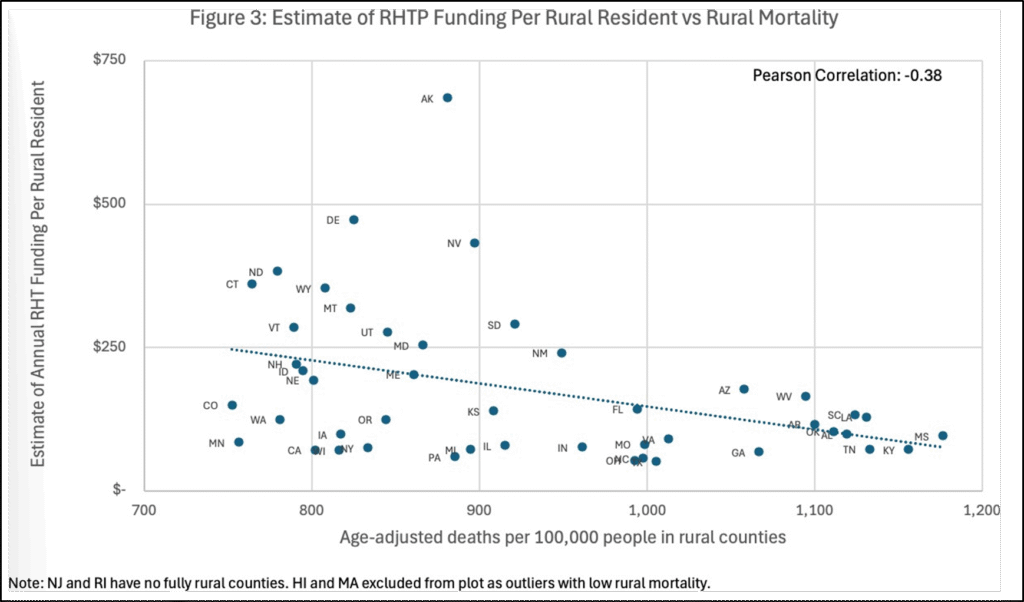
To understand the health needs of rural people, we grouped states according to “high”, “medium”, and “low” age-adjusted rural mortality rates. States with the highest rural health needs had an average age-adjusted rural mortality rate of 1,080 per 100,000 people while states with the lowest rural health needs had an average age-adjusted mortality rate of 755 per 100,000 people.
Estimated RHTP funding allocations do not appear to be clearly aligned with rural health needs (Figure 3): states with higher rural mortality rates are estimated to receive less formula-based RHTP funding per rural resident.
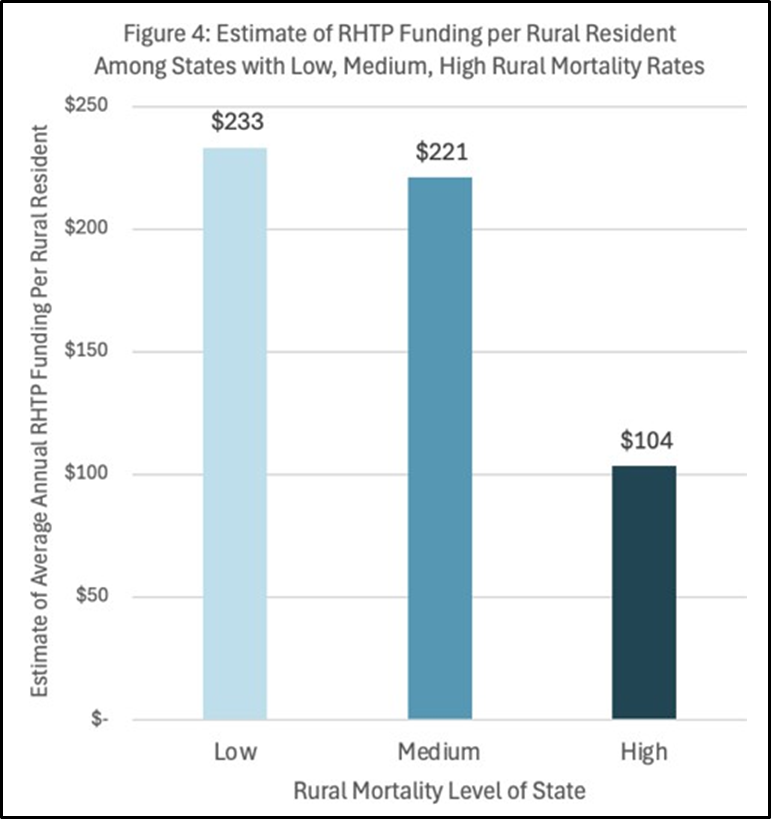
After grouping states according to high, medium, and low rural mortality rates, states with the highest rates are estimated to receive $104 per rural resident, on average, compared with states with the lowest rural mortality rates which are estimated to receive $233 per rural resident (Figure 4).
For most states, RHTP funding allocations are several orders of magnitude smaller than total projected state-level Medicaid spending reductions (Figures 5 & 6). Because RHTP funding may not vary significantly across states, largely due to the baseline funding allocations, projected total Medicaid spending reductions have little meaningful relationship to RHTP funding allocations.
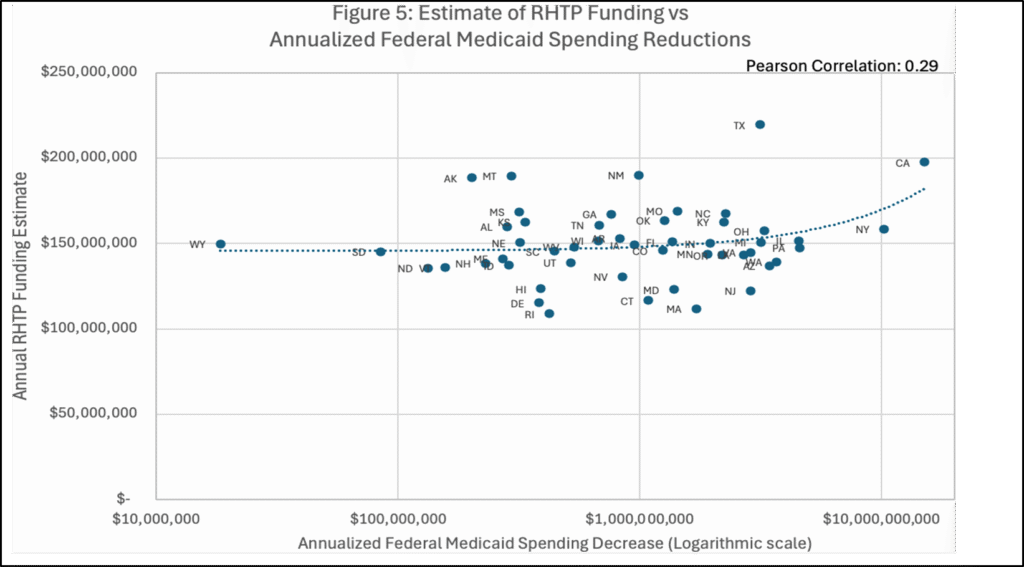
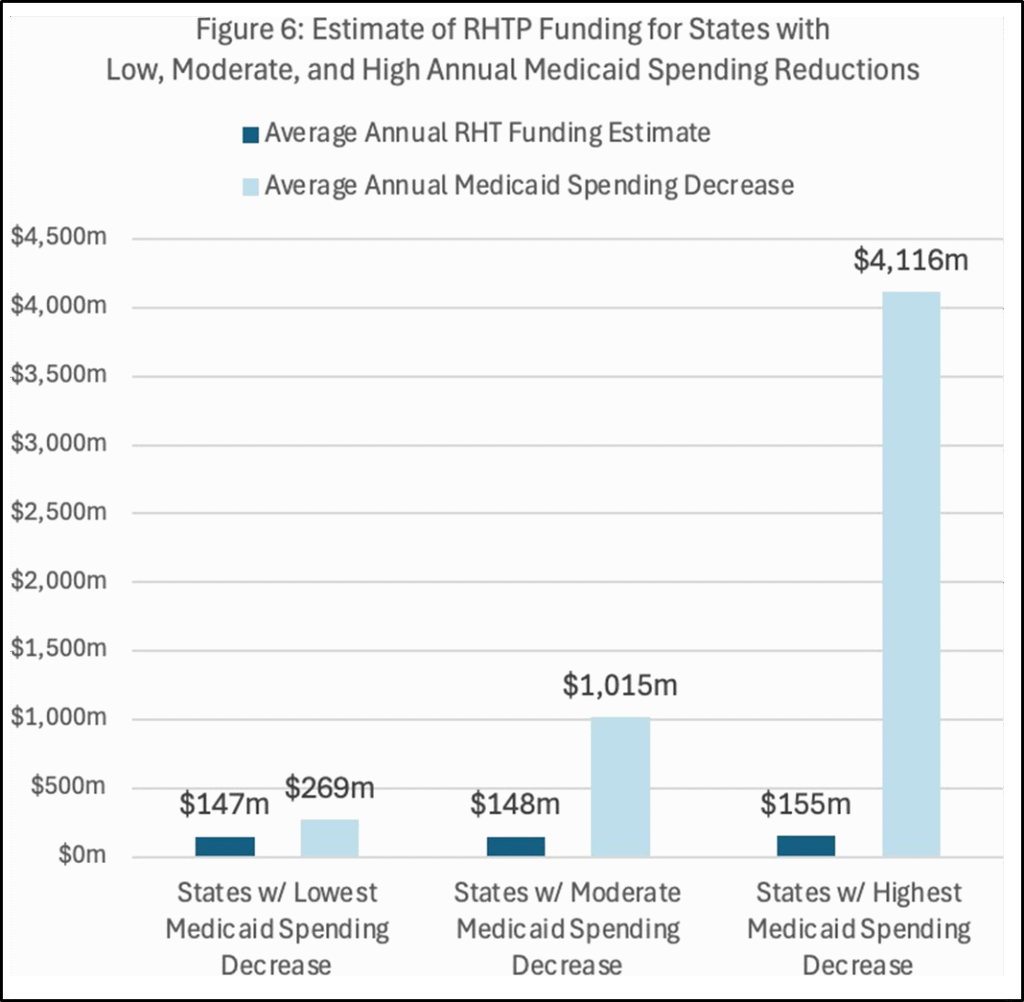
When grouped by projected federal Medicaid spending reductions (Figure 6), states with the largest projected reductions (average of $4.1 billion in annualized Medicaid cuts) are estimated to receive $155 million in RHTP funds annually, while states with the smallest projected reductions (average of $269 million in annualized Medicaid cuts) are estimated to receive $147 million, on average.
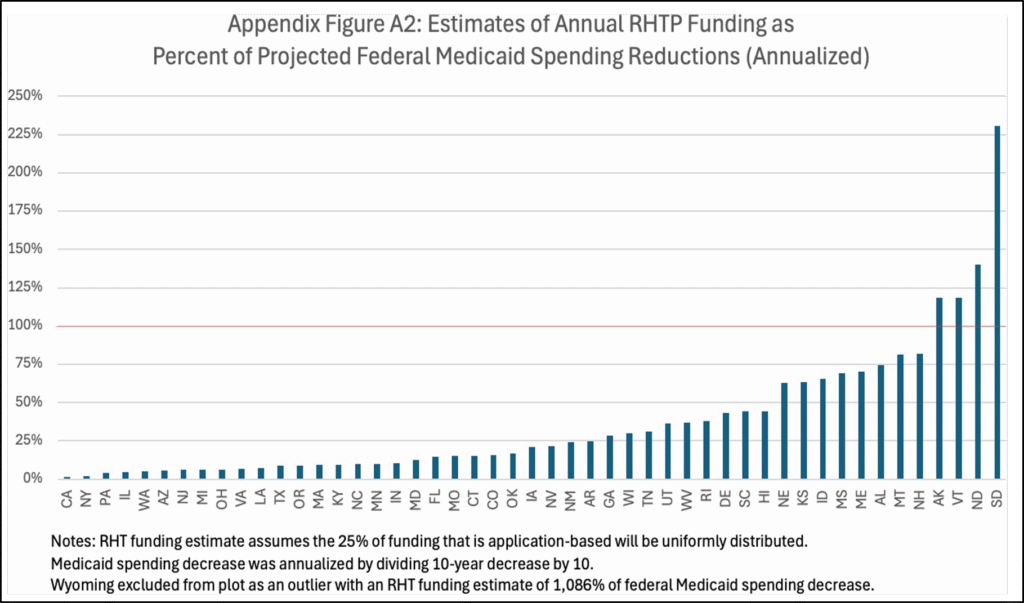
We also estimated the 75% of RHTP funds as a share of a state’s annualized Medicaid cuts (Figure A2). Only five states—Alaska, Vermont, North Dakota, South Dakota, and Wyoming—are projected to receive RHTP funds that meet or exceed their estimated annualized reductions in federal Medicaid spending. All other states fall short, with California, New York, Pennsylvania, and Illinois estimated to have RHTP funding allocations that make up the smallest shares of their anticipated Medicaid cuts.
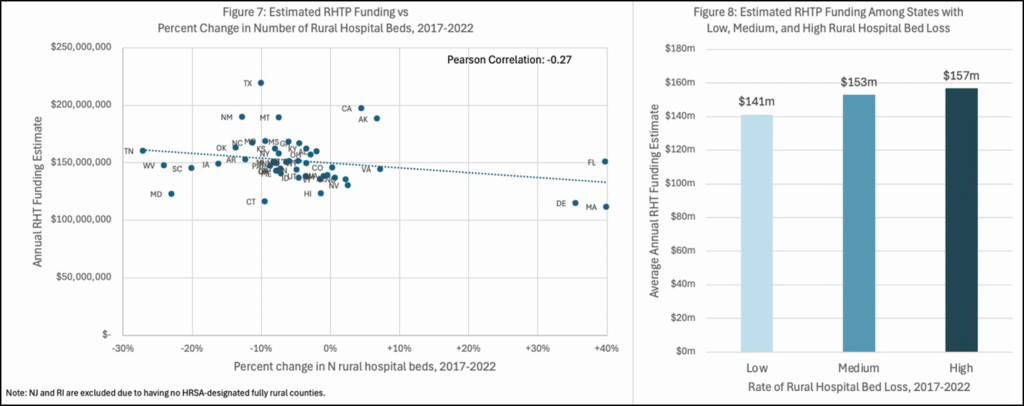
States that had the largest declines in the share of rural hospital beds from 2017-2022 are estimated to receive more RHTP funding, though the margin of difference is modest (Figure 7). After grouping states by rural hospital bed losses, states that lost the largest share of rural hospital beds are estimated to receive $157 million per year, while states that lost the smallest share of rural hospital beds are estimated to receive $141 million per year, on average (Figure 8).
We conducted several additional subgroup analyses with the following summary findings:
We appreciate your office’s commitment to understanding how RHTP funding may interact with major changes to Medicaid and meet the health needs of rural people. We hope this analysis provides clear, independent evidence to support ongoing policy discussions aimed at improving rural health in the United States.
Please contact us with any further questions.
1 We estimated annual RHTP funding allocations per state based on available details on the published formula for allocations in the Notice of Funding Opportunity from CMS. The Notice provides a formula that allows us to estimate 75% of the total funding but with several key assumptions: we assume that 50% of the total is distributed as “baseline funding” across states and 25% is determined based on a series of “rural facility and population score factors”. These factors include absolute size of rural population in a state, percent of state population located in rural areas, proportion of rural health facilities in the state, uncompensated care in the state, metrics that define a state as “frontier”, total square mile area of the state, and percent of hospitals in the state that receive Medicaid Disproportionate Share Hospital Payments. We do not estimate the remaining 25% which is derived from a “technical score”, based on CMS’ review of “application information, data metrics, and current state policies”. States submitted applications for this component of RHTP funding in November 2025. Per CMS’ authority, it is possible that some states may not receive funding if they are not “approved”. Outside of the “baseline funding”, CMS retains authority to allocate funds according to their priorities, such that details on the actual allocation of funds relative to scoring criteria are not yet available. Data for our calculations were obtained from the Health Services & Resources Administration (HRSA), US Census (2020), CMS Provider of Services Files (2025), CMS Healthcare Provider Cost Reporting Information System (2025), CMS State-Plan-Rate-Year Files (2019), and the Substance Abuse & Mental Health Services Administration (2025). We repeated our analysis using calculations of rural facilitation and population score weights that were publicly available from the UNC Sheps Center and found consistent results. A full distribution of estimated funding by state is included in the appendix, Figure A1.
2 We estimated rural health needs by calculating age-adjusted rural mortality rates based on people living in rural counties in a state. We used a definition of “rural“ consistent with the RHTP’s definition from HRSA’s Federal Office of Rural Health Policy. Age-adjusted mortality data were obtained using HDPulse from the National Institute of Health and averaged over 2019-2023.
3 Using state-level estimates from the Kaiser Family Foundation (KFF), we compared estimated RHTP funding allocations with projected total reductions in federal Medicaid spending based stipulations in H.R.1, One Big Beautiful Bill Act. These projections are based on a variety of state-level factors and Congressional Budget Office estimates to measure the decrease in federal Medicaid spending. We annualized KFF’s 10-year estimates of federal Medicaid spending reductions by dividing by 10, though many states will see larger federal Medicaid spending reductions in later years.
4 We calculated each state’s percent change in the number of hospital beds from 2017–2022 using annual changes in the total number of hospitals located in rural counties using the Area Health Resources File. We used a definition of “rural“ consistent with the RHTP’s definition derived from HRSA’s Federal Office of Rural Health Policy.
5 Data on rural population subgroups were obtained from the US Census (2020), and data on the rural health care workforce were obtained from the Quarterly Workforce Indicators (2018-2023). We again used a definition of “rural“ consistent with the RHTP’s definition from HRSA’s Federal Office of Rural Health Policy.
Figure A1. RHTP Annual Funding Estimates
This graph depicts annual estimates of the 75% of RHTP funding that can be assessed with existing data across states, based on the universal “baseline allocation” across states and the portion of “workload funding” attributable to the “rural facility and population score”.
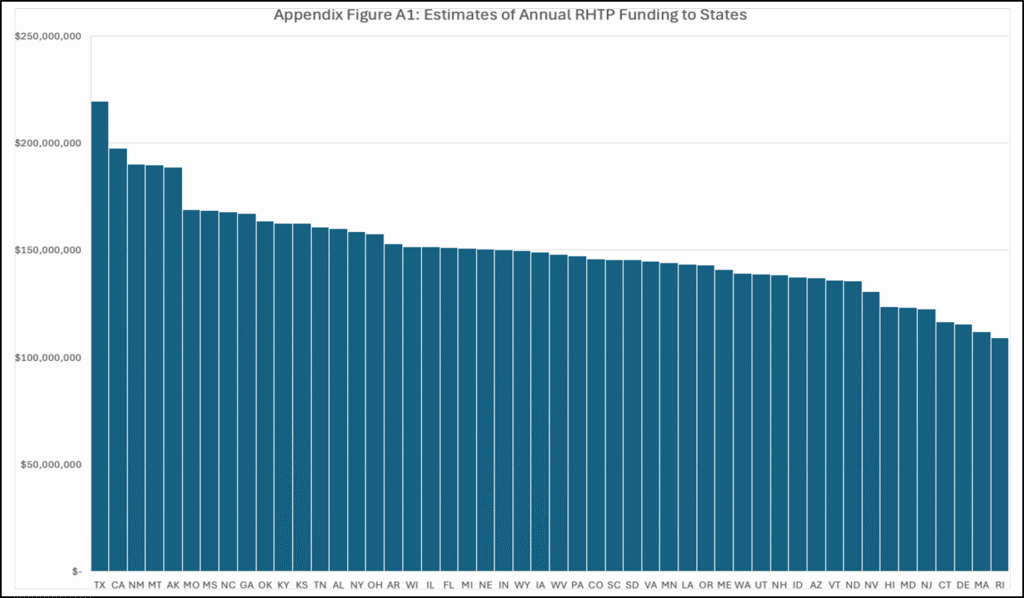
Figure A2. Estimated Annual RHTP Funding Allocations as a Percent of Annualized Federal Medicaid Spending Reductions
This graph depicts estimated annual RHTP allocations as a share of projected Medicaid cuts, based on annualized KFF estimates of 10-year federal spending reductions.
Testimony: Delivered to Philadelphia City Council’s Committee on Health and Human Services

Testimony: Delivered to Philadelphia City Council’s Committee on Labor and Civil Service

Comment: Delivered to the National Center for Complementary and Integrative Health

Comment: Submitted to the U.S. Department of Veterans Affairs

Comment: Delivered to the U.S. Department of Labor

Memo: Delivered to the U.S. Food and Drug Administration (FDA)