Black Older Adults With Cancer Are Far Less Likely to Get Any Care
New Study From LDI and MD Anderson Finds That Black and Low-Income, Dually Eligible Medicare Patients Are Among the Most Neglected in Cancer Care
Blog Post

Every fall, a new bevy of TV ads hits the airwaves, using celebrities to hawk Medicare Advantage plans. Those ads have helped make MA plans the top choice for most seniors, surpassing traditional Medicare. MA’s market share – 26 percent in 2010 — more than doubled to 54 percent of beneficiaries by 2024.
Yet MA costs taxpayers far more than traditional Medicare. And it’s hard for researchers to learn exactly how well these MA plans serve seniors because their data are full of gaps and don’t compare easily with traditional Medicare, according to a recent editorial in JAMA Network Open by Brown University Health Economist David J. Meyers and LDI Executive Director Rachel M. Werner.
Most data from MA plans are incomplete, and nursing homes and home health are the most underreported areas, the authors note.
There may also be bias in the way the plans describe their members’ medical diagnoses because MA plans get paid more for sicker patients. Because plans have a financial incentive to make patients look sicker than they are, comparisons with traditional Medicare can be misleading.
In their editorial, Meyers and Werner proposed six steps researchers can take to sharpen their analysis. Here’s a summary of their suggestions:
Use datasets that are more reliable across MA and TM, such as the Medicare Current Beneficiary Survey. For hospital utilization, try the Medicare Provider Analysis and Review data. The Minimum Data Set (MDS) and the Outcome and Assessment Information Set (OASIS) data are good for nursing home and home health utilization.
Look at how utilization of the service under review is reported across different MA contracts over several years. Is it consistent? If one contract reports unusually low usage of a service (like primary care), that contract might need to be excluded or flagged.
Compare the MA data with other trusted datasets like the Medicare Provider Analysis and Review to see if service use numbers (for hospital visits, for example) match up reasonably well.
Try estimating how sick patients are using drug data or earlier health records—not the MA encounter data, which may inflate risk.
Avoid using diagnosis codes that come from medical record reviews or health risk assessments if you can avoid it. Avoid using the hierarchical condition category (HCC) model for risk adjustment. If you must use it, try updated scoring systems that reduce bias (like version 28 of the HCC model, which can remove suspect conditions).
Test how much your results change depending on whether or how you adjust for patient risk. Try adjusting MA risk scores by a fixed amount (e.g., 16%) to see how much upcoding may be affecting your findings.
MA encounter data are useful but imperfect. By taking extra steps and being transparent about limitations, researchers can still learn a lot—while avoiding misleading conclusions.
The editorial, “Studying Medicare Advantage With Existing Data—Pitfalls, Challenges, and Opportunities,” was published on July 23, 2025 in JAMA Network Open.


New Study From LDI and MD Anderson Finds That Black and Low-Income, Dually Eligible Medicare Patients Are Among the Most Neglected in Cancer Care

Her Transitional Care Model Shows How Nurse-Led Care Can Keep Older Adults Out of the Hospital and Change Care Worldwide

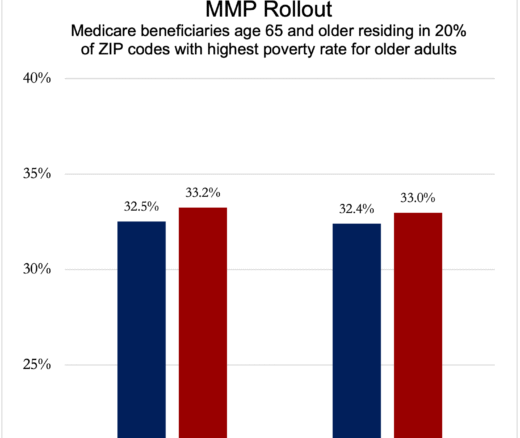
Chart of the Day: Medicare-Medicaid Plans—Created to Streamline Care for Dually Eligible Individuals—Failed to Increase Medicaid Participation in High-Poverty Communities

Penn LDI Debates the Pros and Cons of Payment Reform

Direct-to-Consumer Alzheimer’s Tests Risk False Positives, Privacy Breaches, and Discrimination, LDI Fellow Warns, While Lacking Strong Accuracy and Much More

One of the Authors, Penn’s Kevin B. Johnson, Explains the Principles It Sets Out